Latitude for Fantasy
Base image: common domain Tom Patterson - Equal Earth (https://equal-earth.com) Modified with Photoshop and inDesign
Down with Mercator projection!
With fantasy writing—and science fiction as a form of fantasy—we want to know about journeys taken by our heros. How did they travel? For how long? And what problems did they encounter along the way? Answering these questions requires accurate distance, not by a map that stretches a single point—the North Pole—into a line that’s 25,000 miles long.
Both Mercator and equirectangular projections convert a sphere into a cylinder, rendering the Arctic as huge, and Africa as tiny. None of us are capable of drawing plausible continents when faced with such distortion. And software to draw freehand on a sphere isn’t available.
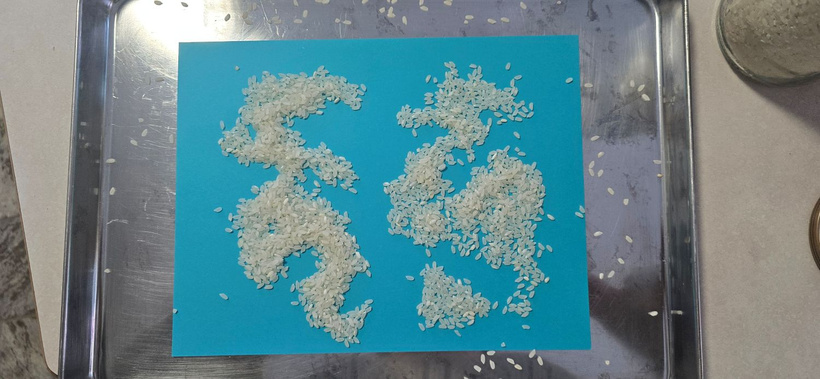 Rice on blue paper
Some common methods of fantasy mapping include spreading rice on a sheet of paper and drawing around the rice to produce the coastlines. This results in blobs on a rectangle that don’t relate to the mapping of a sphere or to events in a story.
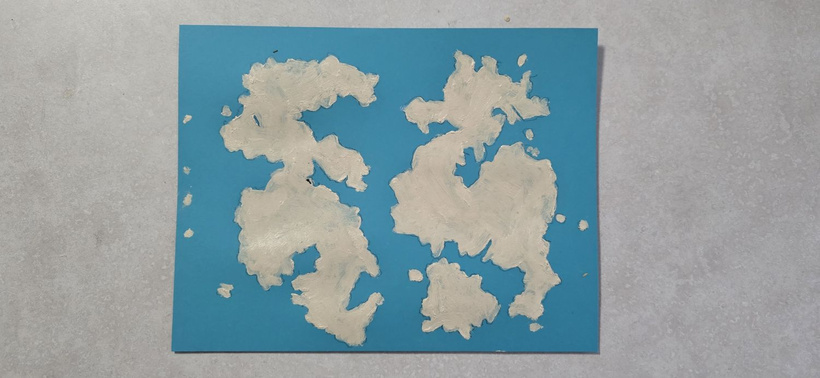 Blobs painted on blue paper
Another method is to use an online fantasy mapping site.
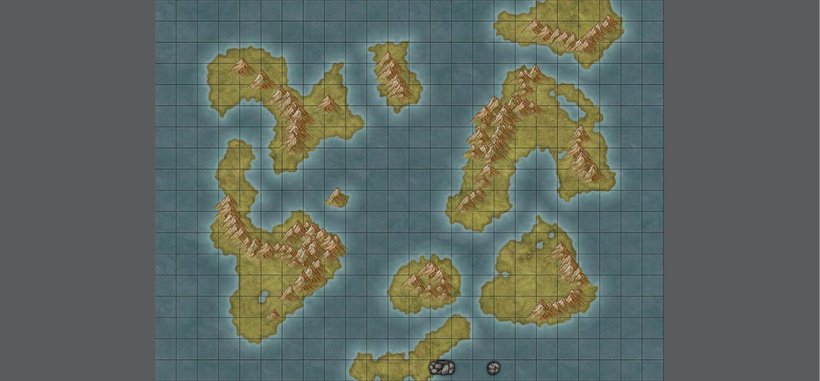
Produced using Inkarnate.com
This world map produced with Inkarnate, also resulted in blobs on a rectangle. The proportions of the rectangles are wrong. This grid with 15° per longitudinal line, should be 24 by 12. Inkarnate creates beautiful small-scale maps, but not world maps.
Drawing on Spheres
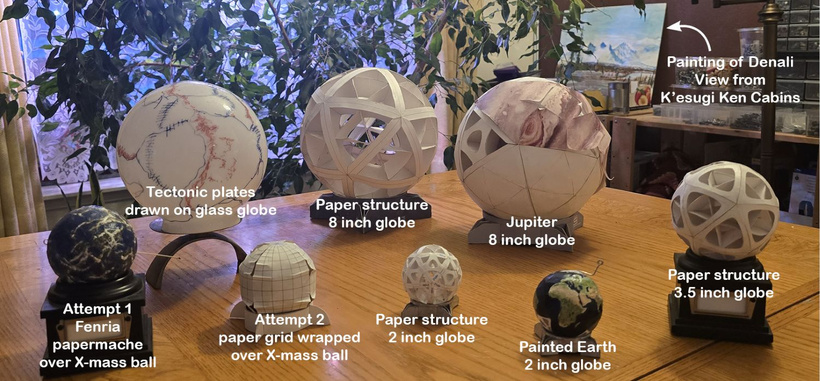
Attempt 1, on the left mimics, the rice method with wrinkled paper mache, forming mountains touched up with white paint. It dead-ended with the need to transfer the map to a flat surface.
Attempt 2. Fitting a flat piece of paper with 4 panels over a globe. The paper didn’t lay flat.
Attempt 3 Draw with markers on a glass globe. Same problem with transferring to a flat surface.
Further attempts. These treat the globe as made up of 20 equilateral triangles. The idea was to build the triangles into the structure of the globe and having removable paper panels. After dozens of models, this didn’t pan out. Building the globes and attaching the panels was overly complex. It did produce some lovely models of the Earth—second from the right in the front. Painting these models led to a better understanding of the climate and geography of Earth. They eventually led to a much simpler method, one that focuses on latitude and makes use of Google Earth.
With the Latitude method, start with the settings described in a story and determine the climate. Backward engineer for the latitudes. Place the locations on a latitude and longitude grid and fill in the parts in between.
Climate and Latitude
Sunlight
Latitude is the angle of the North Star or Southern Cross above the horizon, 90° at the poles, 0° on the equator. The higher your latitude, the closer you are to one of the poles.
Based on latitude, we divide the Earth into 5 climate bands: the Arctic Circle, the northern temperate zone, the tropics, the southern temperate zone, and the Antarctic Circle.
Polar circles have at least one day during the winter when the sun doesn’t rise.
Temperate zones have winter and summer, which the tropics lack. During the winter, the sun is low. During the summer, it’s higher.
Most fantasy stories happen to be set in the northern temperate zone at the latitude of Europe, approximately 50°N
The Tropics On the equator, at noon, during the equinox, the sun is directly overhead. After the vernal equinox (northern spring) the sun travels to the north of overhead. After the autumnal equinox (northern fall) the sun travels to the south of overhead. The equinoxes are warm, the solstices are cool.
Precipitation, Rain and Snow
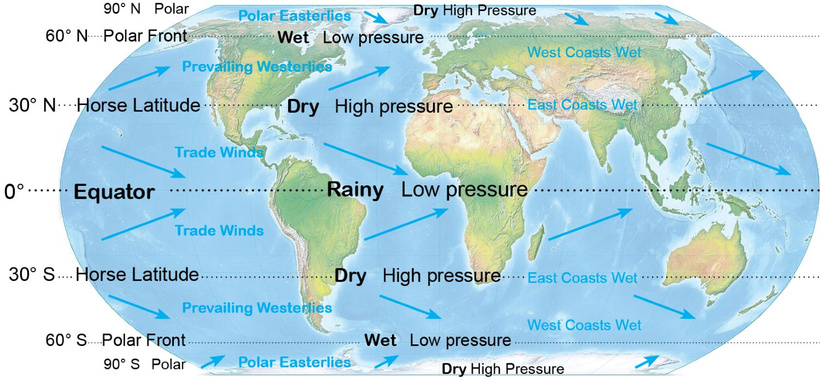
 Base image: common domain Tom Patterson - Equal Earth (https://equal-earth.com) Modified with Photoshop and inDesign
0° The Equator—Amazon, Congo, and Borneo—has the highest rainfall. For tropical rainforest, place the fantasy setting near or on the equator.
30° The Horse Latitudes features deserts— Mojave, Sahara, and Great Indian deserts, in the south, Atacama, Kalahari, and Australian deserts. Wet regions at 30° (China and the North American southeast) are on the eastern side of continents. Place your fantasy desert in the Horse Latitudes.
50° – 60° hosts rain and rainforests on west coasts—Cascadia, Ireland, and Tierra Del Fuego.
90° The Poles are cold and dry. They may have snow cover, but snow rarely falls. For cold temperatures but little snow fall, place your setting in a polar region.
Wind
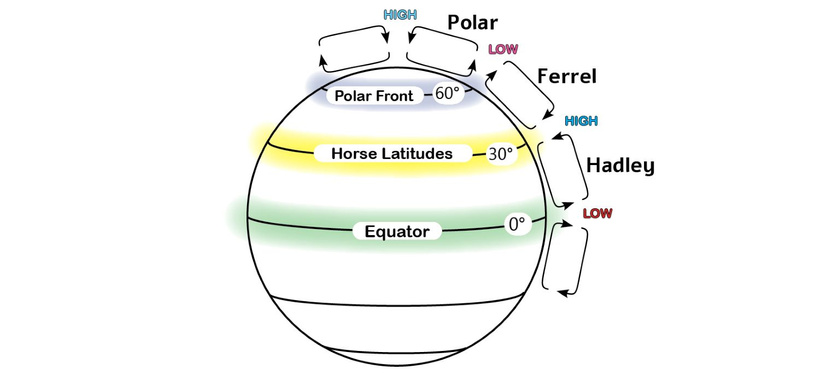 By author using inDesign
Heated air rises, cools, and drops, moving in circular patterns called convection cells. The spin of the Earth deflects the winds toward the east.
Earth’s atmosphere has 3 sets of major convection cells that meet in alternating regions of high and low pressure.
Hadley cells rise at the equator. At 30° they drop, forming the subtropical highs—the Horse Latitudes.
- Winds from the east.
- Wet on east coasts and on the eastern side of mountain ranges.
- Rain shadows to the west.
Ferrels drop at 30°, along with the Hadleys, and blow from the west. They rise at 60°, along with the Polar cells, forming the Polar Front lows.
- Winds from the west.
- Wet on the west coasts and the western side of mountain ranges.
- Rain shadows to the east.
Polars rise at 60°, along with the Ferrels, forming the Polar Front low. They drop at 90°
- Cold and dry.
- Wind moves away from the poles.
Mountains
- The higher the elevations, the colder the temperatures.
- Mountains are wet to the windward side and dry to the leeward side.
Ocean Currents
Ocean currents tend to move in a counterclockwise direction in the Northern Hemisphere, clockwise in the southern hemisphere sending warm water along east coasts cold water along west coasts. This is why China and southeast North America are rainy despite being at a latitude that’s typically arid.
Working with Graphic Files
Maps could be hand drawn, but this doesn’t solve the problem with distortion, so digital drawing is the best way to go.
Graphic files are of 3 major types.
- Raster Pixel-based drawing, painting, and photo editing.
- Photo editing Photoshop. Gimp. Affinity Photo.
- Drawing and painting Corelpaint. Autodesk Sketchbook.
- Vector Mathematically based drawing. Coreldraw. Adobe Illustrator, Affinity Designer. Inkscape.
- Typography Typeface-based images. InDesign. Affinity Publisher.
The map could be done entirely in photo editing software, but working with all 3 types yields the best results
Producing a Grid
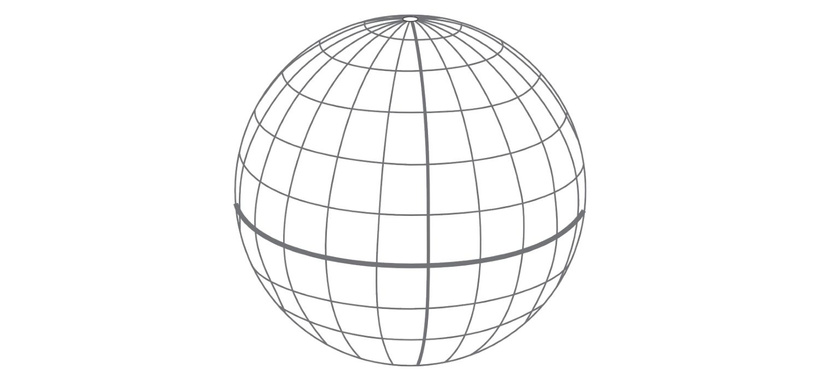 Hemispherical grid using base-twelve coordinate system: 2 dozen longitude lines, 1 dozen latitude lines. Produced using Google Earth, Sketchbook, and Coreldraw.
 Aim for a vector-based grid of longitude and latitude for a single hemisphere. The distortion of the map will be intuitive, the same distortion encountered in normal human views of spheres. In vector, you can rescale, refine, and change line width without losing quality.
Creating the grid could be done directly in vector, but getting the correct distortion for 53 circles is beyond fiddly. For an easier method, trace a grid from an image.
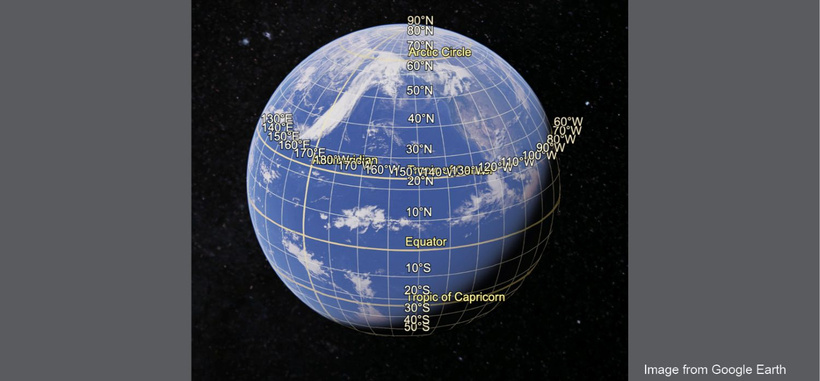 From Google Earth
In Google Earth, turn on Grid, located under the View tab. Adjust the view of Earth to see a full hemisphere. Take a screenshot.
- Open a painting program and place the screenshot as a layer. Trace over the grid. Google has grid lines every 10°. I prefer 15° between lines, so eyeballed the location of every other longitudinal line.
- For the most flexibility, save as a Photoshop .psd file.
- Export the grid as .jpg and place it as a layer in a vector drawing program. I tried vector initially, but found it clunky for the preliminary drawing. Vector allows adjustment of size, color, and line thickness without degradation. Save the drawing.
- Exported the grid as .svg (vector) or as .gif or .png, which allow for transparency.
Using the Grid
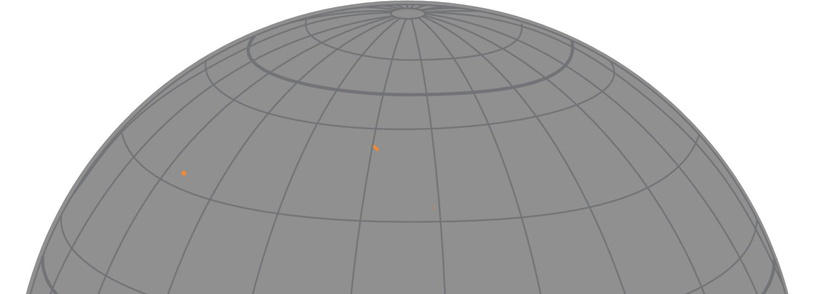 The orange rectangle are for the locations for Kold Strait, Comyrez Pass, and Fennako City
- Open a new painting/drawing and import/place the grid as a layer.
- Add each location as a dot on a separate layer. Move the layers, positioning dots at the desired latitude and longitude. Determine longitude by calculating the distance and speed of travel for the characters in the story.
Drawing Land
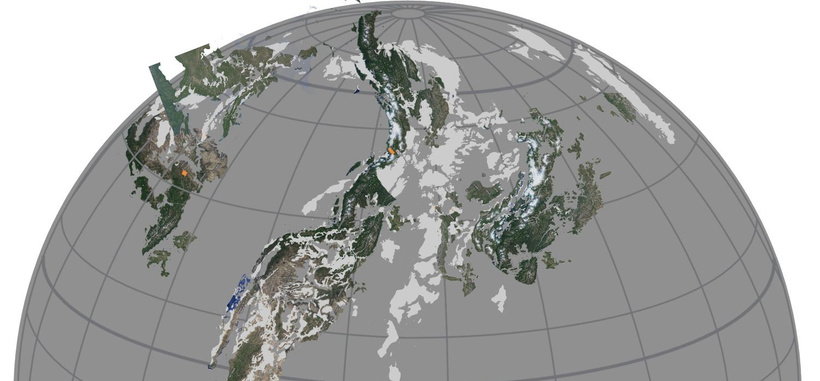 Produced using Sketchbook and a Wacom tablet
- Freehand the land using a pressure-sensitive stylus and a pen tool from the brush menu. The pen tool can be shifted between color and colorless to sculpt the shapes.
- Or use screenshots from Google Earth as a guide. The screenshot goes in as a layer and can be adjusted for size and location based on grid lines.
- Sculpting the screenshot using the pen tool. Be sure to make a duplicate layer before sculpting. Alter the land enough that the source isn’t identifiable.
- When everything extra has been carved away, create a mask from the water area and invert the mask. Make the land a solid color using the bucket tool. The shade can be changed again using the same mask and invert method.
Glaciers Create a layer. Sculpt the glaciers using the pen tools with white or colorless
Contours If desired, draw and sculpt each elevation on a separate layer. Mask and invert to change color. It works best to have low elevations dark, and high elevations light. Dark recedes visually.
Rivers If desired, add the major rivers on a layer. Make sure rivers match the elevations and coastlines. Rivers typically form treelike patterns with the branches flowing together. When they meet the ocean, they sometimes split, forming deltas, fan-shaped deposits with multiple channels. Avoid splitting a river in any location that’s not on a delta.
Modify the coastlines and contours where necessary.
Save the map as a Photoshop .psd file
Distance Key
 Produced using Coreldraw
- For an easy way to produce a key, draw it in a vector program as a graph. Color the boxes alternating black and white. Export the key as .jpg,.gif, .png, or .svg and place as a layer in the map image.
- Establish distance by using the Google Earth ruler tool and matching this to a location on the map.
- Adjust scale of the key layer to match the information from Google Earth.
Compass Rose
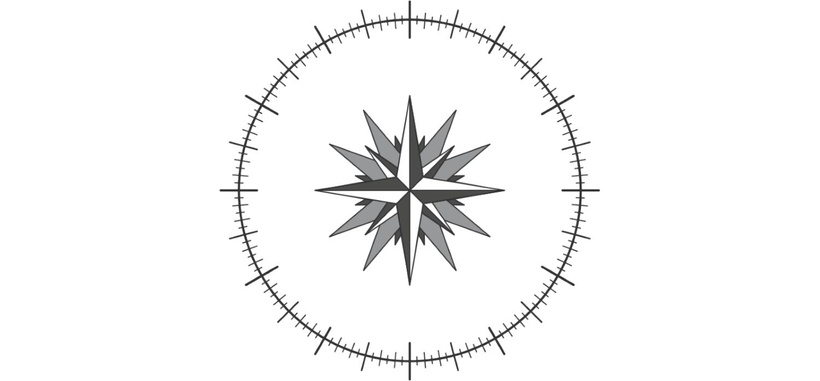 Compass Rose for base twelve coordinate system. Produced using Coreldraw
A compass rose can be produced as vector (Coreldraw, Adobe Illustrator) Export as .gif or .png for transparency or as .svg.
Assemble Assets
For best results, use a typesetting program such as inDesign or Affinity Publisher.Ebooks require .jpg. Print books require Adobe print files .pdf.
- Start with print. In the typesetting program, select Document Setup to designate page size and margins.
- Place the linked map file on a page. If linked, any changes made to the map image can be easily incorporated.
- Adjust frame and position of image to show desired part of the map.
- Add compass rose, adjust size and angle.
- The key is fiddly since the location can only be changed in the image file, but the numbers and text are in the typography file.
- Export the map pages as .jpg for use in ebooks, Word files, and web pages.
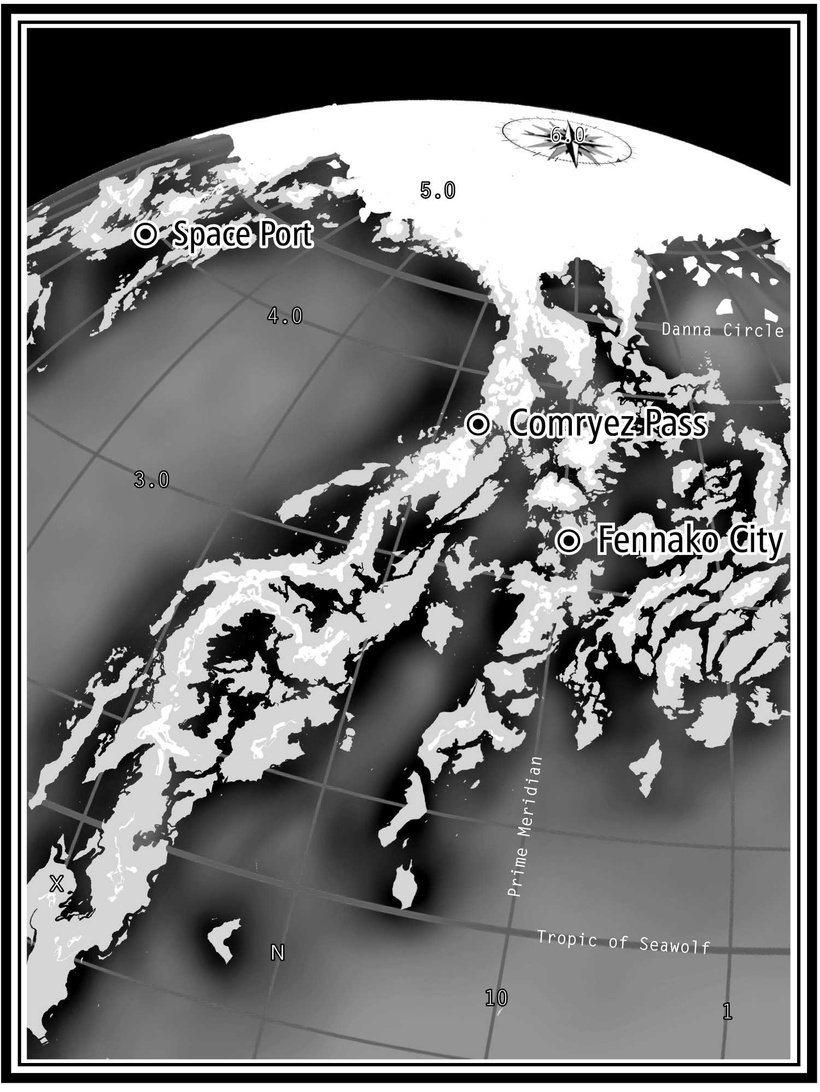 Illustration for Cybernautica: the Return of the Princess. Assembled with inDesign. Base twelve coordinate system.
Export for Publishing
- Word files with .jpg maps are uploaded to ebook distributors for conversion to .epub.
- Reduce the size of the images before uploading to webpages.
- When the entire books is ready to go, it’s exported as .pdf to be uploaded to print distributors such as KDP and Ingram Spark.